Sees what actually leaves the machine, right now — including what your DNS-based tools can't.
Shadow-Traffic watches real outbound TCP connections for a fixed window (default 2 minutes), reads the destination hostname straight off the wire when it can (via the TLS ClientHello's SNI field, using a hand-written low-level packet parser — no external capture tool required beyond Windows' own pktmon), and cross-references every endpoint against Block-Telemetry's known-domain lists. The result: a live picture of what your machine is actually talking to, which process is responsible, and whether any of it is a blocked domain that's still getting through.
Not to be confused with Check-Network — see Shadow-Traffic vs. Check-Network below if you're not sure which one you need.
- Why this exists
- Screenshots
- Shadow-Traffic vs. Check-Network
- What it does
- What it does not do
- Requirements
- First run (step by step)
- Quick start
- Desktop shortcut
- Parameters
- Reading the console output
- How classification works
- The HTML report
- Reports and files
- Block-Telemetry integration
- Privacy
- Self-test
- Troubleshooting
Block-Telemetry blocks domains at the DNS level, by null-routing them in the hosts file. That's effective, but it's also blind in one specific way: it can only ever tell you what got asked for by name. A hardcoded IP address, a resolver baked into an app instead of the OS (DNS-over-HTTPS inside NVIDIA App, for example), or a domain nobody thought to add to the blocklist yet — none of that shows up in a hosts-file-based tool, because the DNS lookup that would have triggered the block never happens.
Shadow-Traffic asks a different question than "is this domain on the list?". It asks "what is my computer actually connecting to, on the wire, right now?" — by sampling real TCP connections and, where possible, reading the real destination name straight out of the TLS handshake, regardless of whether a DNS lookup for it was ever logged. It's the difference between checking a guest list and standing at the door.
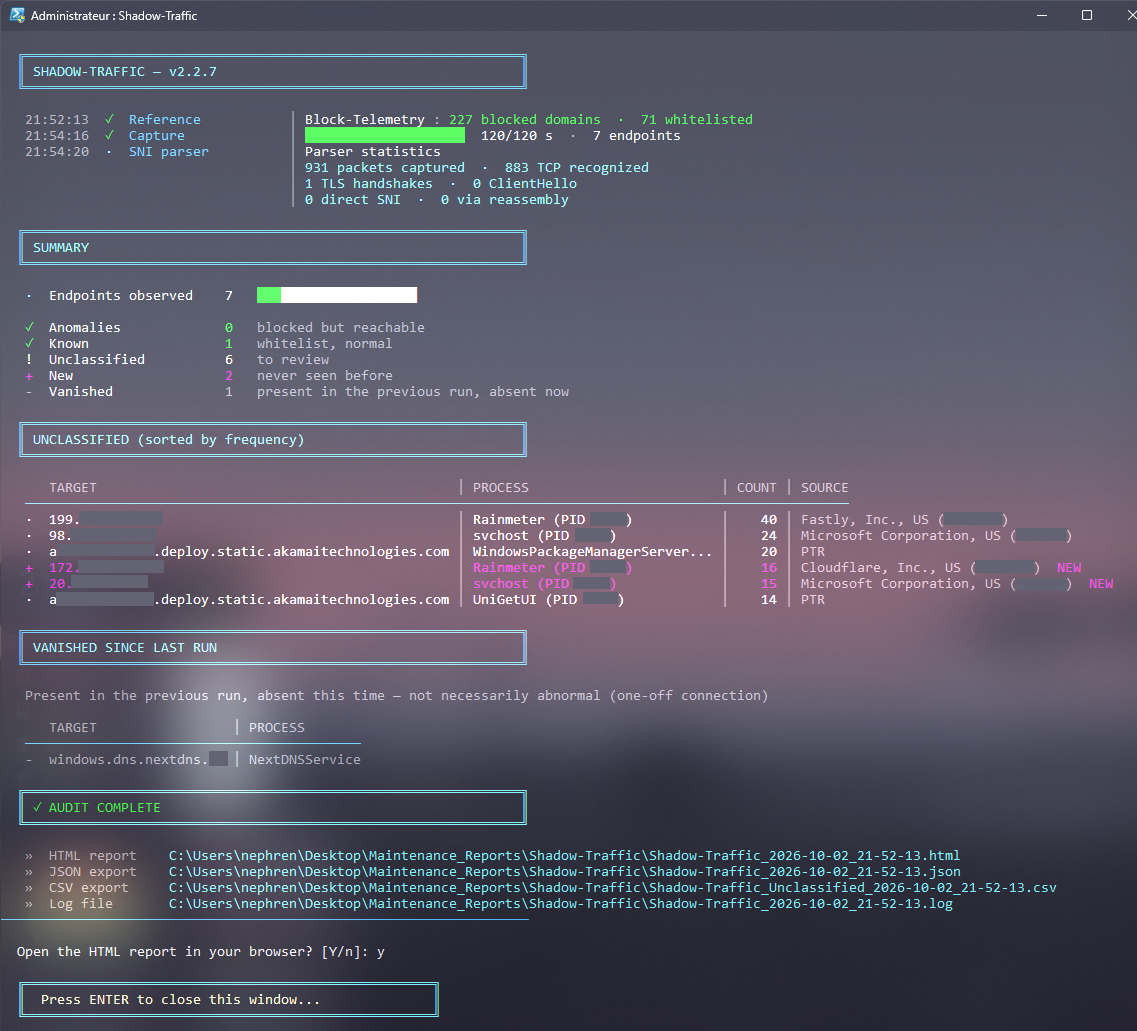
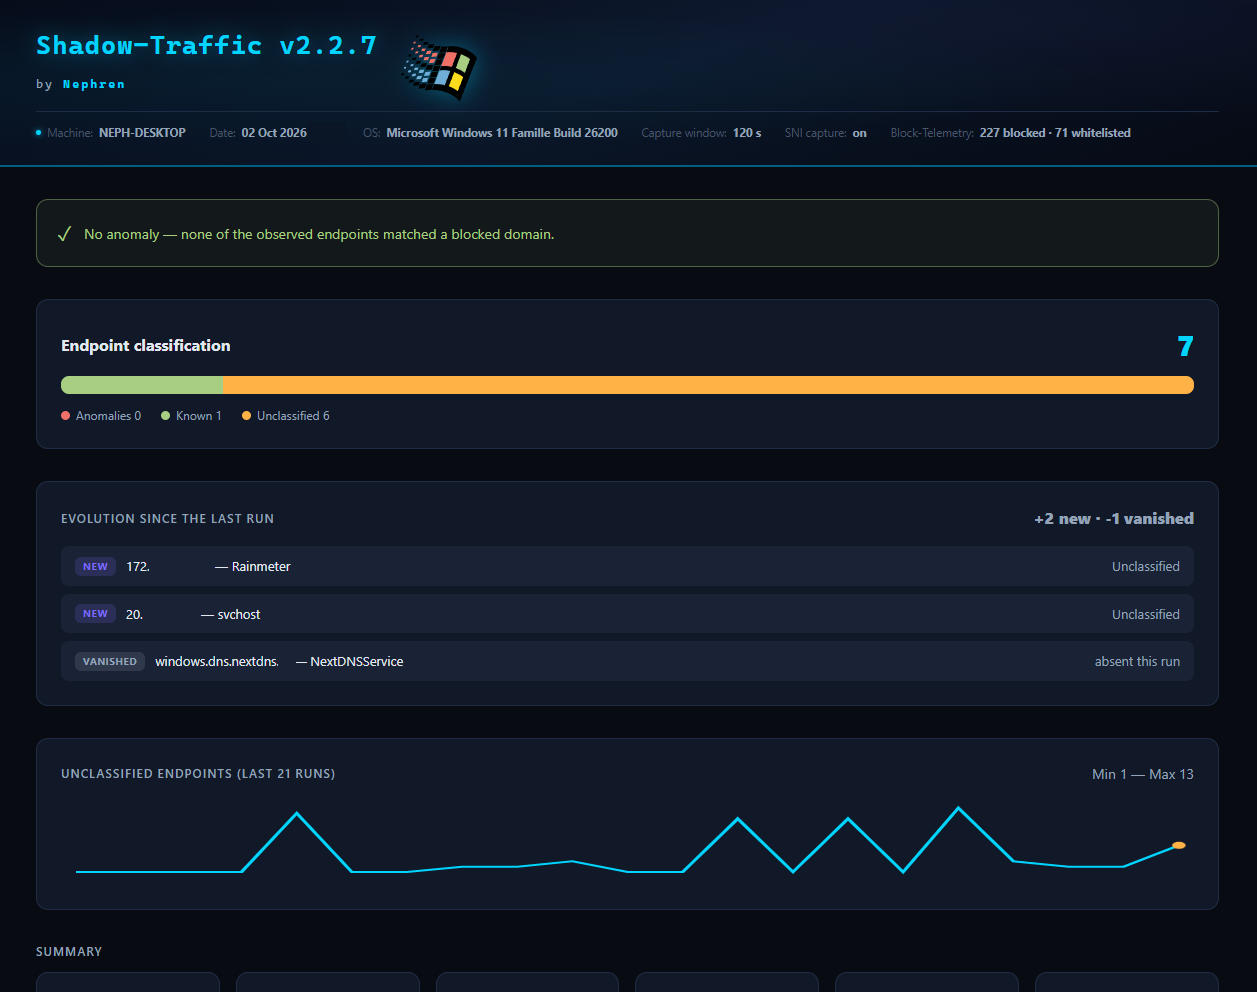
More in screenshots/.
Both scripts inspect network activity, both produce an HTML/JSON/CSV report, and both live in the same "Windows 11 maintenance" suite — so it's an easy pair to mix up. They answer completely different questions:
| Check-Network | Shadow-Traffic | |
|---|---|---|
| Question it answers | "Is my network connection healthy and secure?" | "What is my machine actually talking to, right now?" |
| Nature | One-shot health/security scan | Live traffic capture over a time window |
| Duration | A few seconds to ~1 minute (mostly instant checks + an optional speed test) | A configurable window, 120 seconds by default (-DurationSeconds) |
| What it looks at | Adapters, gateway latency, DNS servers, DoH/NextDNS config, Wi-Fi history, root certificates, throughput, captive portal, IPv6/DNS leaks | Real TCP connections your processes have open, plus (optionally) the TLS SNI hostname read directly from the packets |
| Output style | A 0–100 score per category (Connectivity / Security / DNS) | A classified list of endpoints: Known / Unclassified / ANOMALY |
| Needs admin rights? | Yes, always | Only for -CaptureSNI (packet capture via pktmon); the base TCP audit does not |
| Typical use | "Is something wrong with my network or DNS setup?" | "What's this process actually sending data to, and is any of it something I meant to block?" |
Short version: run Check-Network to check the health of your connection. Run Shadow-Traffic to see what's actually crossing the wire and catch anything slipping past Block-Telemetry.
- Samples real outbound TCP connections (
Get-NetTCPConnection) every 5 seconds over the observation window, recording destination IP, port, owning process, and how many times each endpoint was seen. - Optionally (
-CaptureSNI) runs a live packet capture viapktmonin parallel with the same window, and parses the raw Ethernet/IP/TCP/TLS bytes itself to extract the SNI (Server Name Indication) — the actual hostname the destination server was asked for during the TLS handshake. No external tools (Wireshark, tshark...) required. - Reassembles a ClientHello that got split across two TCP segments on the wire (best-effort, contiguous segments only).
- Counts UDP:443 traffic (QUIC/HTTP3) separately, so it's visible in the totals even though its contents aren't decoded.
- Resolves a reverse DNS (PTR) name for endpoints with no captured SNI, and falls back to an ASN/organization lookup (via Team Cymru's public DNS service, no API key needed) when even that fails — so "204.79.197.203" becomes "Microsoft Corporation (AS8075)" instead of staying an opaque number.
- Cross-references every named endpoint against Block-Telemetry's blocked and whitelisted domain lists, and flags anything that matches a blocked domain as an ANOMALY (it got through despite being on the blocklist — a bypass).
- Keeps a persistent baseline (
Baseline_Shadow-Traffic.json) across runs, so it can flag endpoints that have never been seen before. - Compares against the previous run's report to flag endpoints that were present before and have vanished this time.
- Produces a dark-themed HTML report in the same style as Check-Security: summary cards, a classification bar, the evolution since the last run, a history chart, live search, filter chips and sortable columns.
- Purges its own old reports automatically (
-PurgeDays, default 60 — the baseline is never purged). - Shows a desktop toast notification with a one-line summary when the run finishes.
- Can filter the whole audit down to a single process (
-ProcessName).
- It does not decode QUIC/HTTP3 traffic — UDP:443 packets are counted, not inspected (QUIC's own encryption makes this significantly harder than TLS-over-TCP, and it's out of scope for this tool).
- It does not handle IPv6 extension headers in the packet parser.
- It does not reassemble more than two contiguous TCP segments, and cannot recover from packet loss or reordering — a ClientHello split across many out-of-order segments may be missed.
- It does not replace a real network capture tool for deep investigation — if
Shadow-Trafficflags something suspicious, a proper packet capture (Wireshark) is still the right next step for a full investigation. - It does not check the health of your connection, your DNS configuration, or your adapters — that's Check-Network's job.
- It does not block anything itself — it only observes and reports. Blocking is Block-Telemetry's job.
- Windows 10 (1809+) or Windows 11 —
pktmon(used for-CaptureSNI) ships natively from these versions on. - PowerShell 5.1 (built into Windows) or PowerShell 7+.
- Administrator rights are only required for
-CaptureSNI. The script prompts for elevation automatically (UAC) when that flag is used; the base TCP-only audit runs fine without admin rights. - Block-Telemetry is optional but strongly recommended — without it, every endpoint will show up as "Unclassified" instead of Known/ANOMALY, since there's nothing to compare against.
Windows blocks scripts downloaded from the internet by default (Mark of the Web). If you double-click the .ps1 file or see a warning about the script being blocked, this is normal and expected for any downloaded PowerShell script — not specific to this one.
- Right-click
Shadow-Traffic.ps1→ Properties → check Unblock (bottom of the General tab) → OK. - Or, from a PowerShell window in the script's folder:
Unblock-File .\Shadow-Traffic.ps1
- If running scripts is disabled entirely on your machine, allow locally-created/unblocked scripts to run:
Set-ExecutionPolicy RemoteSigned -Scope CurrentUser
- Run it (see Quick start below).
For a more detailed walkthrough (including what each warning actually means and why), see the Script-blocked-Look-at-this guide.
Check that the script runs correctly on your machine (no capture, no admin rights needed — runs 33 internal checks and exits):
.\Shadow-Traffic.ps1 -SelfTestSee Self-test for what it covers.
Basic 2-minute TCP-only audit, no admin rights needed:
.\Shadow-Traffic.ps1Full audit with SNI capture (requires admin — you'll get a UAC prompt):
.\Shadow-Traffic.ps1 -CaptureSNILonger window, one specific process only:
.\Shadow-Traffic.ps1 -CaptureSNI -DurationSeconds 300 -ProcessName nvcontainerQuiet run for a scheduled task (still writes the reports, no console output, no toast):
.\Shadow-Traffic.ps1 -CaptureSNI -Silent -NoToast- Right-click the Desktop → New → Shortcut.
- Paste this as the location (adjust the path to where you saved the script):
powershell.exe -NoProfile -ExecutionPolicy Bypass -File "C:\Path\To\Shadow-Traffic.ps1" -CaptureSNI - Name it, finish, and you're done — the script requests elevation itself when
-CaptureSNIis used, so there's nothing else to configure.
| Parameter | Default | Description |
|---|---|---|
-DurationSeconds <N> |
120 |
Length of the observation window, in seconds. TCP sampling and SNI capture (if enabled) both run for this same duration. |
-BlockTelemetryPath <path> |
auto-detected | Path to Block-Telemetry.ps1. If omitted, the script looks for it in its own folder. |
-IncludeLocal |
off | Includes private/loopback IPs (192.168.x, 10.x, 127.0.0.1...) in the results. Excluded by default since they're rarely interesting. |
-SkipSlowChecks |
off | Disables reverse-DNS (PTR) and ASN lookups, for a faster run. Endpoints without a captured SNI will show only as raw IPs. |
-CaptureSNI |
off | Enables packet capture via pktmon to extract real hostnames from the TLS handshake. Requires administrator rights (triggers UAC). |
-ProcessName <name> |
none | Restricts the audit to connections owned by processes matching this name (partial match, case-insensitive). |
-PurgeDays <N> |
60 |
Deletes this script's own reports (json/csv/html/log) older than N days. 0 disables purging. The baseline file is never purged. |
-NoToast |
off | Disables the desktop notification shown when the run finishes. |
-DebugClientHello |
off | Saves, in hex, any ClientHello the parser detected but couldn't extract an SNI from (direct or after reassembly), to a Debug-ClientHello\ subfolder — useful for reporting a parser bug. |
-SelfTest |
off | Runs the built-in test suite (33 assertions) and exits. No real capture, no admin rights needed. |
-Silent |
off | Reduces console output to a minimum. Logs and reports are still written normally. |
A typical run prints:
- A framed header banner with the script name and version.
- A Reference line: whether Block-Telemetry was found (✓) or not (!), and how many blocked/whitelisted domains it loaded.
18:40:12 ✓ Reference │ Block-Telemetry : 227 blocked domains · 71 whitelisted - A live progress bar while sampling connections, updated in place. It turns into a ✓ line once the window is complete:
18:42:07 · Capture │ ████████░░░░░░░░░░░░ 45/120 s · 12 endpoints - A SUMMARY block — one line per category, with a stacked bar showing how the endpoints split between anomalies (red), known (green) and unclassified (yellow):
An icon turns into a green ✓ when its count is zero (anomalies, unclassified).
· Endpoints observed 18 ████████████████████ ✗ Anomalies 1 blocked but reachable ✓ Known 6 whitelist, normal ! Unclassified 11 to review + New 3 never seen before - Vanished 2 present in the previous run, absent now - If any anomalies were found, an ANOMALIES table listing each one — this is the section to look at first.
- An UNCLASSIFIED table, sorted by how often each endpoint was seen, with the columns
TARGET │ PROCESS │ COUNT │ SOURCE. Endpoints never seen before get a+icon and aNEWtag.SOURCEtells you where the name came from:SNI,PTR, the ASN (organization and AS number, e.g.Microsoft Corporation, US (AS8075)— the HTML report keeps the full registry text), orno nameif it's a bare IP. Target names longer than 52 characters are shortened with...in the console only — the reports always contain the full name. - If applicable, a VANISHED SINCE LAST RUN table (endpoints that were present in the previous report but not this time — not necessarily a problem, connections can be one-off).
- If SNI capture is on and any SNI couldn't be matched to a TCP connection (the connection was too short-lived to be sampled), an SNI CAPTURED WITH NO MATCHING TCP CONNECTION table.
- A final ✓ AUDIT COMPLETE banner listing every generated file (HTML report, JSON export, CSV export, log), then the prompt offering to open the HTML report and the "Press ENTER to close this window" box.
Every endpoint gets one of these categories, based on its resolved name (SNI takes priority, then PTR, then ASN, then the raw IP) compared against Block-Telemetry's lists:
- ANOMALY — Blocked domain but reachable (possible bypass): the name matches a domain Block-Telemetry blocks, yet the connection went through anyway. This is the category worth investigating: an app might be using a hardcoded IP, DNS-over-HTTPS, or another path that skips your hosts file entirely.
- Known (whitelist, normal): the name matches something explicitly whitelisted in Block-Telemetry — expected, no action needed.
- Unclassified: the name (or IP) doesn't match either list. This is where most of your review time will go — most of these are perfectly normal (CDNs, app backends, services you haven't categorized), but it's also where a genuinely new tracker would show up first.
On top of the category, each endpoint can also be marked:
NEW(a+icon in the console): never appeared in any previous run's baseline.- Listed under Vanished: was present last run, isn't this time.
The report uses the same visual style as Check-Security (header with logo and a meta bar showing the machine, date, OS and capture settings). From top to bottom:
- A banner: red, with jump links to each anomaly, if blocked domains were still reachable; a warning if the Block-Telemetry reference couldn't be found; a green "no anomaly" box otherwise.
- A classification bar splitting the endpoints between anomalies, known and unclassified.
- An Evolution since the last run block listing the new and the vanished endpoints, and a small history chart of the Unclassified count over recent runs (with min/max).
- Summary cards: Total / Anomalies / Known / Unclassified / New / Vanished.
- The detailed table, with a live search box, filter chips (All / Anomalies / Unclassified / Known / New) and sortable columns. Every row shows the target, its category, the owning process (with its PID), the port, how many times it was seen, and where the name came from.
- When applicable, a Vanished since the last run table and a SNI captured with no matching TCP connection table — the same lists the console shows.
Names coming from the network (SNI, PTR, ASN, process names) are HTML-escaped, and SNI/PTR names containing anything other than letters, digits, _ . : - are discarded at capture time.
All files are written to Desktop\Maintenance_Reports\Shadow-Traffic\:
| File | Contents |
|---|---|
Shadow-Traffic_<timestamp>.html |
The interactive report described above. |
Shadow-Traffic_<timestamp>.json |
Full machine-readable snapshot of the run (all endpoints, counts, categories). |
Shadow-Traffic_Unclassified_<timestamp>.csv |
Unclassified and ANOMALY endpoints only, for quick review in Excel. |
Shadow-Traffic_<timestamp>.log |
Plain-text run log (timestamps, warnings, errors, a one-line run summary and the baseline update). |
Baseline_Shadow-Traffic.json |
Persistent history used to detect "never seen before" endpoints. Never purged by -PurgeDays. |
Shadow-Traffic reads Block-Telemetry's domain lists (blocked + whitelisted) to classify what it sees — it doesn't modify Block-Telemetry or your hosts file in any way, it only reads the list for comparison. If Block-Telemetry isn't found (wrong path, not installed, or renamed), the audit still runs, but every endpoint will show up as "Unclassified" since there's nothing to compare against. Point -BlockTelemetryPath at the exact file if auto-detection doesn't find it.
The SNI capture path (-CaptureSNI) necessarily sees which hostnames your machine connects to — that's the whole point. The raw packet capture (.etl/.pcapng files) is deleted immediately after the SNI is extracted from it; nothing is kept beyond the parsed hostname in the reports described above. Everything happens locally: no data is sent anywhere except the (optional, disable-able via -SkipSlowChecks) DNS lookups to Team Cymru for ASN resolution.
.\Shadow-Traffic.ps1 -SelfTestRuns 33 internal assertions covering IP classification, domain classification, the packet parser (built from hand-crafted TLS fixtures, including a real truncated Windows/Edge ClientHello that once broke SNI extraction), TCP reassembly, UDP/QUIC detection, ASN query construction, the baseline round-trip, and output safety (HTML escaping, hostname validation, CSV formula protection, and an end-to-end HTML export). No real capture, no admin rights required.
-CaptureSNI fails / SNI never appears in results.
Make sure you're running as administrator — the script should prompt for elevation automatically, but if it doesn't (e.g. run from an already-elevated but restricted shell), re-launch it manually as admin. Also confirm pktmon is available (Get-Command pktmon) — it ships with Windows 10 1809+ and Windows 11.
Everything shows up as "Unclassified".
Block-Telemetry wasn't found. Pass -BlockTelemetryPath pointing at your actual Block-Telemetry.ps1, or place both scripts in the same folder.
A ClientHello was detected but no SNI was extracted.
Re-run with -DebugClientHello — this saves the raw bytes to Debug-ClientHello\ so the case can be inspected (and reported, if it turns out to be a parser bug).
The run feels slow.
-SkipSlowChecks disables reverse-DNS and ASN lookups, which are the main source of latency when many unclassified IPs need naming.