



An end-to-end data science and machine learning showcase by Sandeep Malviya. This repository demonstrates full-cycle data science workflows: taking raw, realistic Kaggle datasets from ingestion and data cleaning through exploratory data analysis (EDA), rigorous statistical hypothesis testing, and production deployment via interactive Streamlit web applications.
An in-depth analysis and interactive dashboard exploring the Multilingual Mobile App Reviews Dataset 2025 on Kaggle.
- 🌐 Live Interactive App: multilingual-mobile-app-reviews.streamlit.app
- 📓 Kaggle Notebook: View Analysis on Kaggle
- 📁 Project Directory:
MultilingualMobileAppReviewDatasetAugust2025/
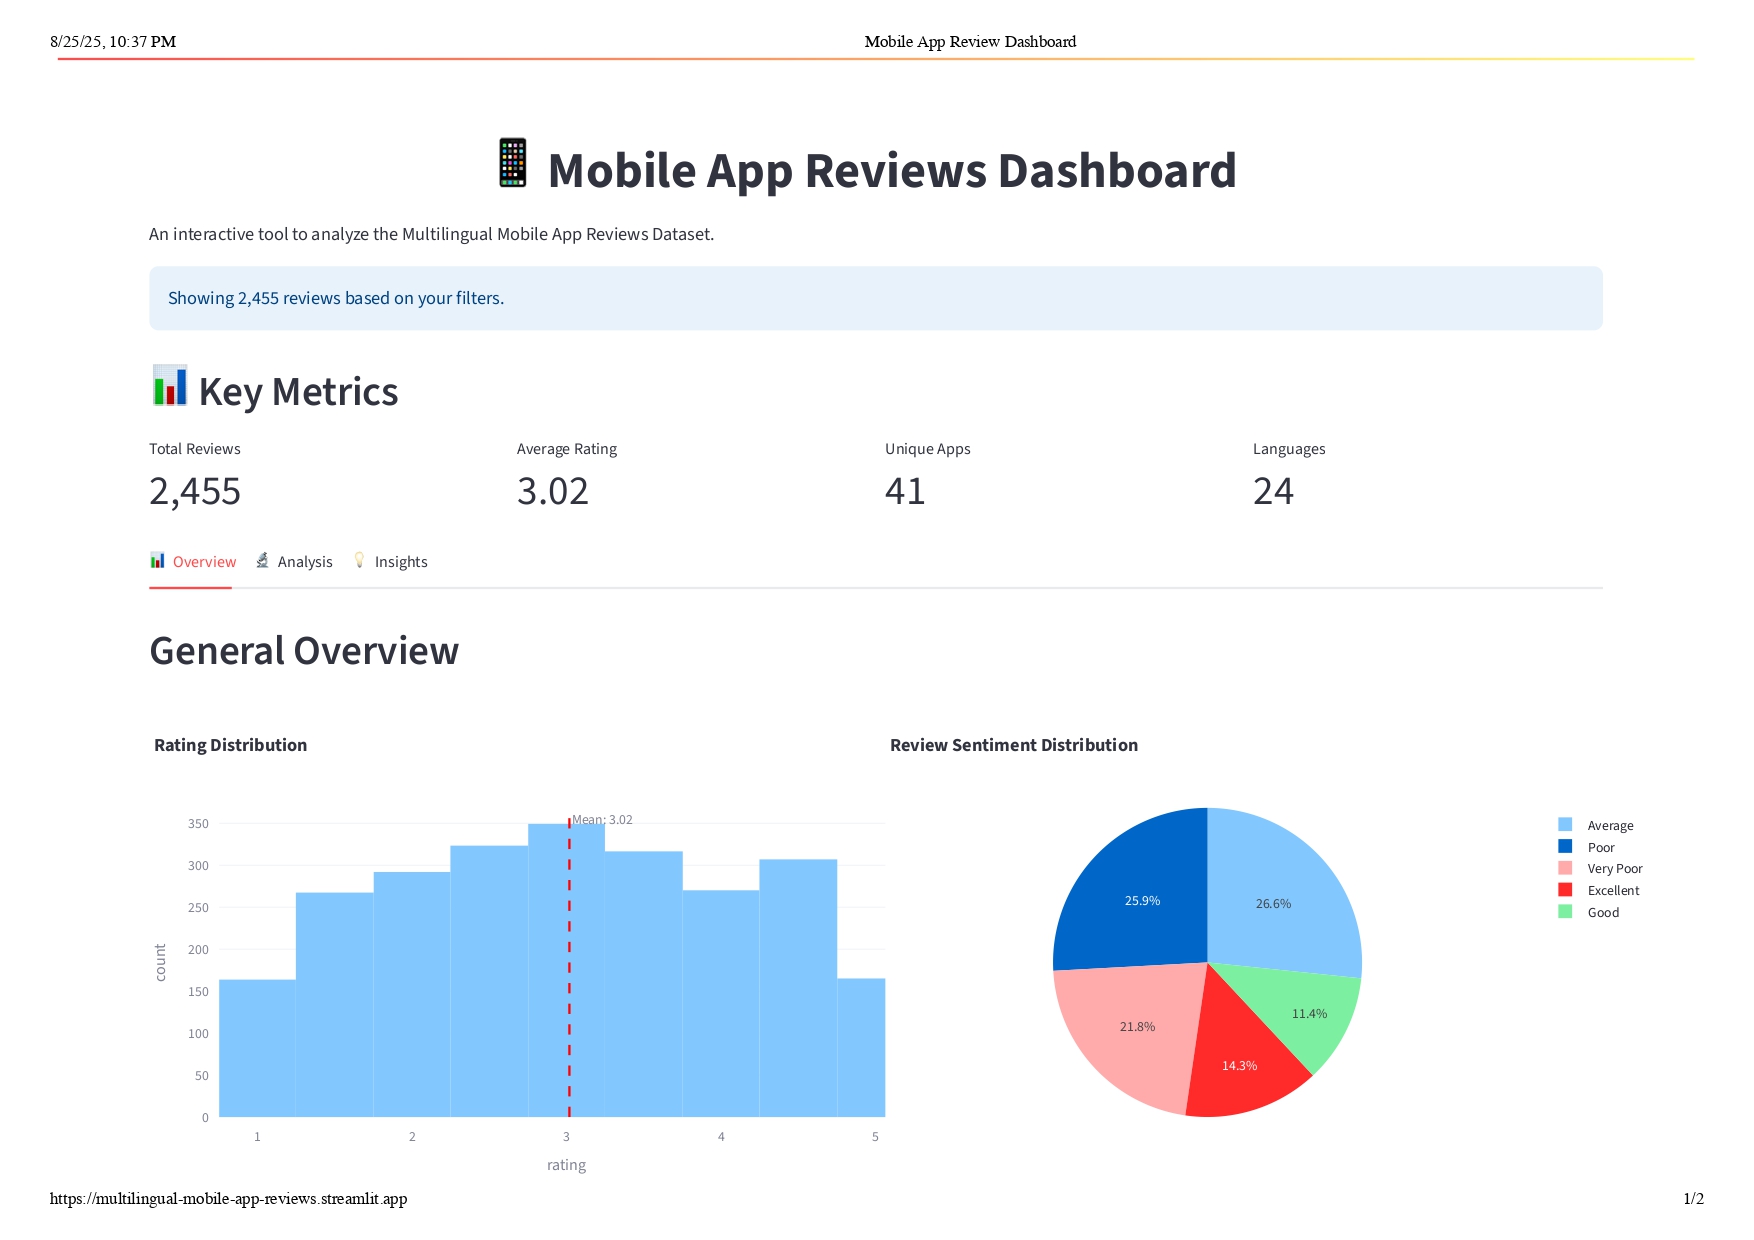
The project analyzes a realistic dataset containing over 2,500 mobile app reviews across 40+ popular applications in 24 different languages. The dataset was curated with real-world data quality challenges (missing attributes, inconsistent data types, and multilingual string encoding), providing a rigorous testbed for production data cleaning pipelines.
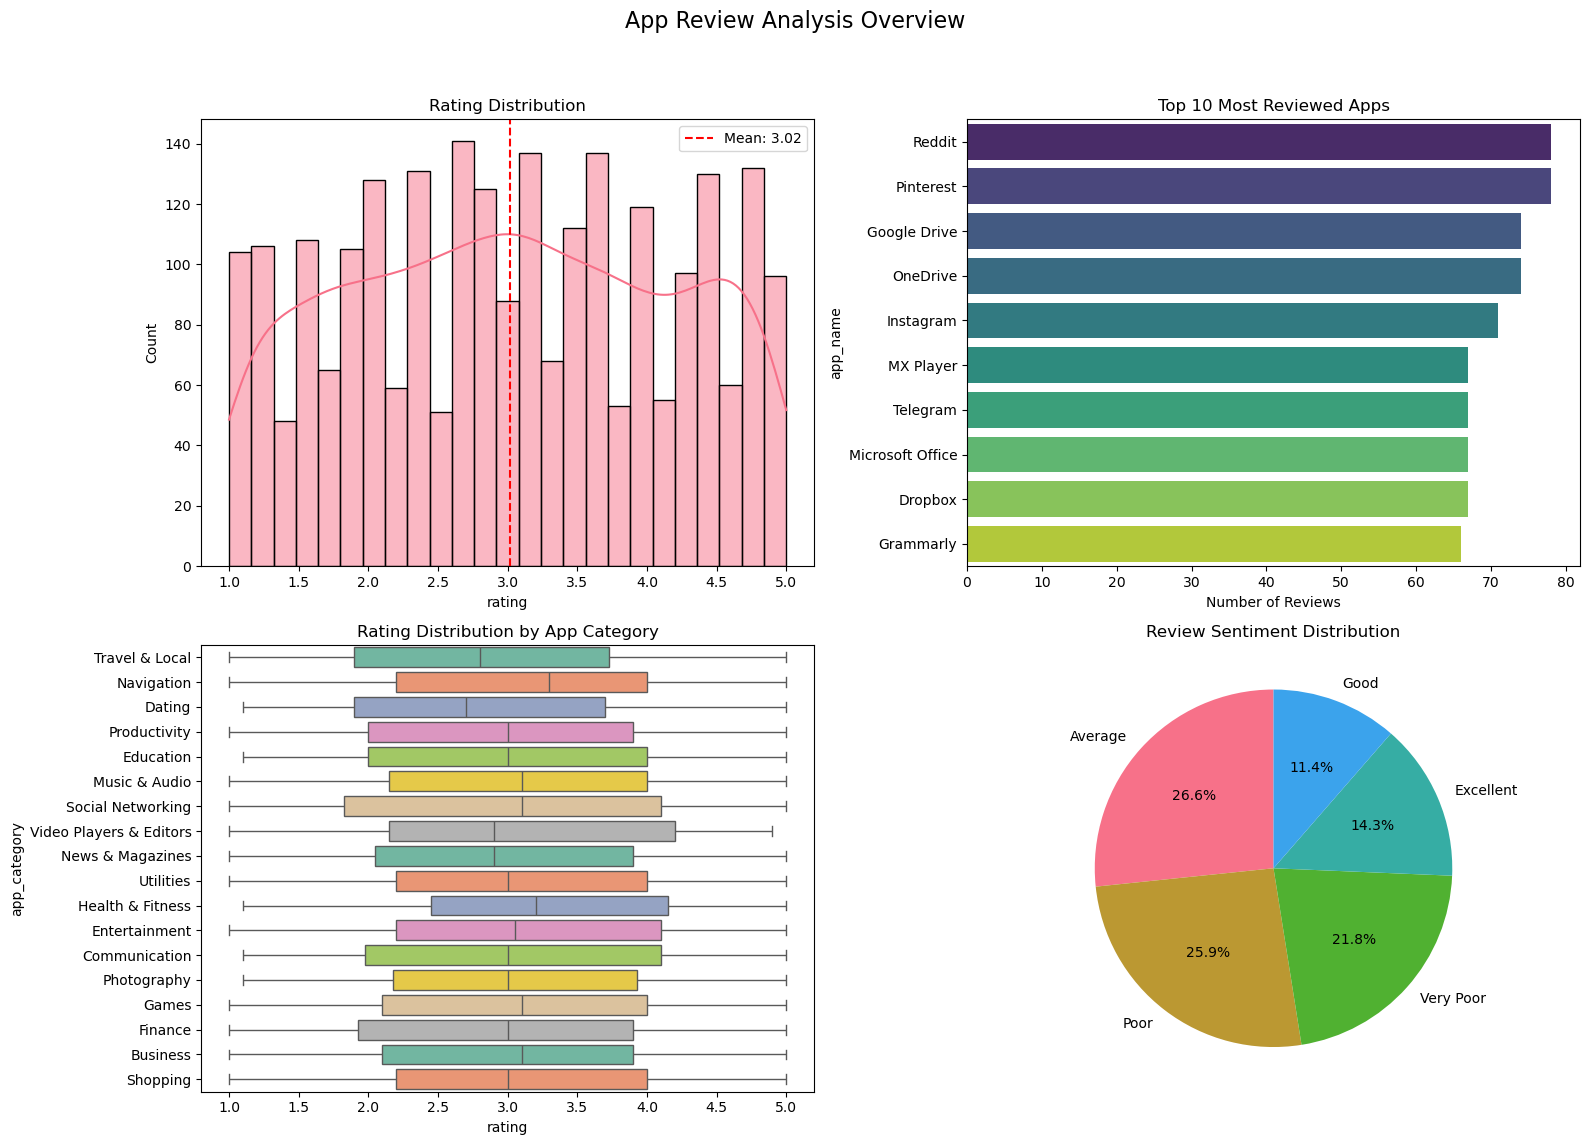
- Rating Distribution: Mean rating of 3.02. Reviews heavily cluster around 'Average' and 'Poor', reflecting the behavioural tendency of users to voice feedback more actively when friction occurs.
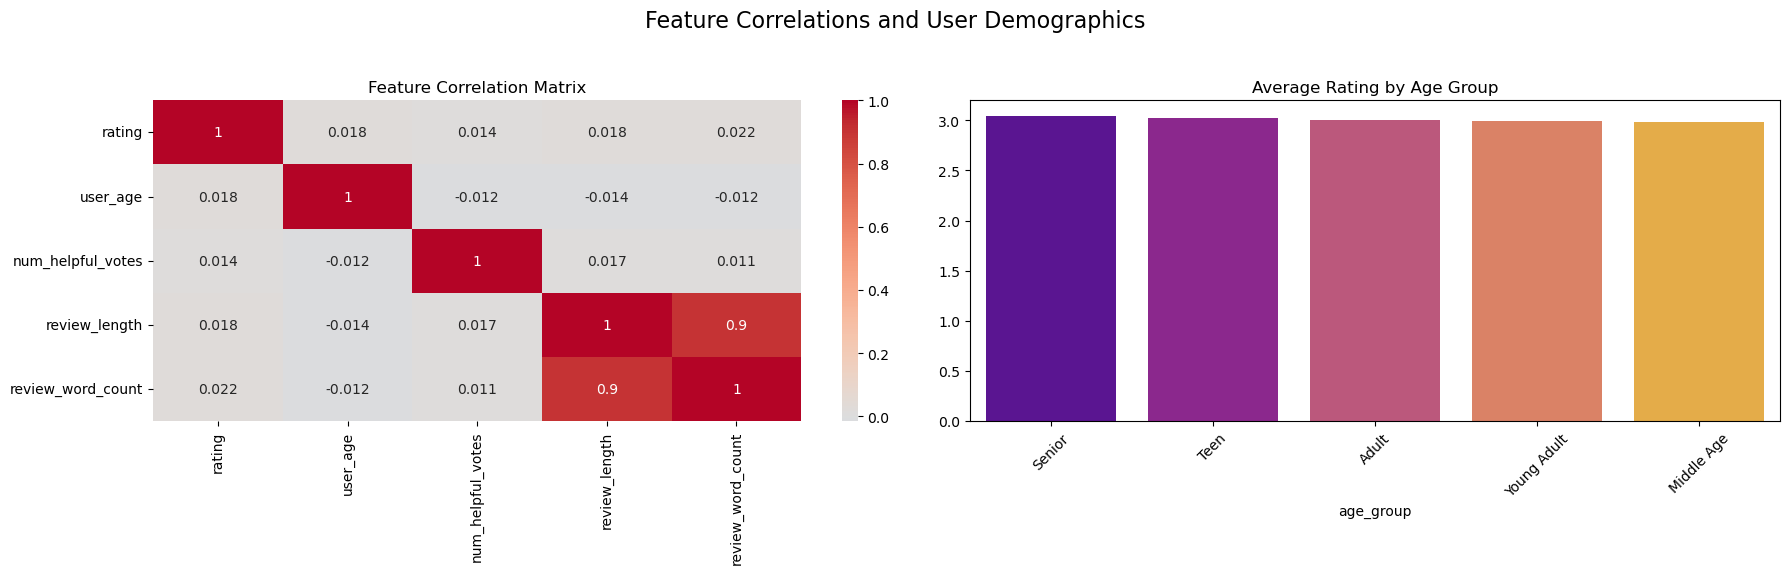
- Review Length & Demographics: Bivariate correlation showed no statistically significant relationship between reviewer age or review token length and the final rating score.
-
ANOVA Hypothesis Testing: A one-way Analysis of Variance (ANOVA) across 18 distinct app categories confirmed no statistically significant variance in mean ratings across functional categories (
$p\text{-value} > 0.05$ ).
| Component | Library / Framework | Application |
|---|---|---|
| Data Cleaning & Wrangling | pandas, numpy |
Handling missing values, type casting, multilingual string normalization |
| Statistical Analysis | scipy.stats |
One-way ANOVA hypothesis testing, Pearson correlation matrix |
| Exploratory Visualizations | matplotlib, seaborn, plotly |
Distribution plots, correlation heatmaps, interactive scatter |
| Web Dashboard Deployment | streamlit |
Multi-filter dashboard deployed on Streamlit Community Cloud |
kaggle_analysis_showcase/
├── MultilingualMobileAppReviewDatasetAugust2025/
│   ├── Output/                       # Generated analysis plots and dashboard previews
│   ├── main_analysis.ipynb           # Comprehensive exploratory data analysis notebook
│   ├── streamlit_app.py              # Interactive web dashboard source
│   ├── requirements.txt              # Project-specific pinned dependencies
│   └── README.md                     # Deep-dive study documentation
├── requirements.txt                  # Root dependencies
├── LICENSE                           # MIT License
└── README.md                         # Main portfolio showcase overview
-
Clone the repository:
git clone https://github.com/SandyCompetent/kaggle_analysis_showcase.git cd kaggle_analysis_showcase/MultilingualMobileAppReviewDatasetAugust2025 -
Install dependencies:
pip install -r requirements.txt
-
Launch the Streamlit dashboard:
streamlit run streamlit_app.py
Distributed under the MIT License. See LICENSE for details.