


Hi, I'm Sandy G. Cabanes, a Freelance Data Analyst and Analytics Engineer with a strong Marketing Research background.
I build end-to-end data pipelines, from automated cloud ingestion to interactive analytics, for small teams and organizations, backed by a strong foundation in Marketing Research.
Tech Stack: dbt, Python, SQL, R, BigQuery, Fivetran, Power BI, Tableau, Excel (Power Query). Cloud Environments: Google Cloud, AWS, Azure, Databricks.
You can browse my analysis projects and case studies in the repositories below.
For a more comprehensive gallery of projects, see the Showcase Page
End-to-end survey analysis and interactive report for Data Engineering Pilipinas, covering 1,861 responses from the Philippine data and tech community, including career shifters, students and current data professionals. Built with Python, Plotly, and GitHub Pages. Covers demographic profiling, compensation benchmarking, tools landscape, and learning behavior across 5 interactive report pages.
| Page | Description |
|---|---|
| Home | Landing page and executive navigation |
| Executive Summary | Key findings at a glance |
| About Us | Demographics, roles, career stage, education |
| Compensation | Salary profiles by role, industry, and experience |
| Tools & Tech | Most-used tools, platforms, and technologies |
| Learning & Community | Learning habits, program attendance, AI adoption |
| Drivers of Job Satisfaction | Key drivers using machine learning and Shapley values |
Tableau Report

SHAP Analysis

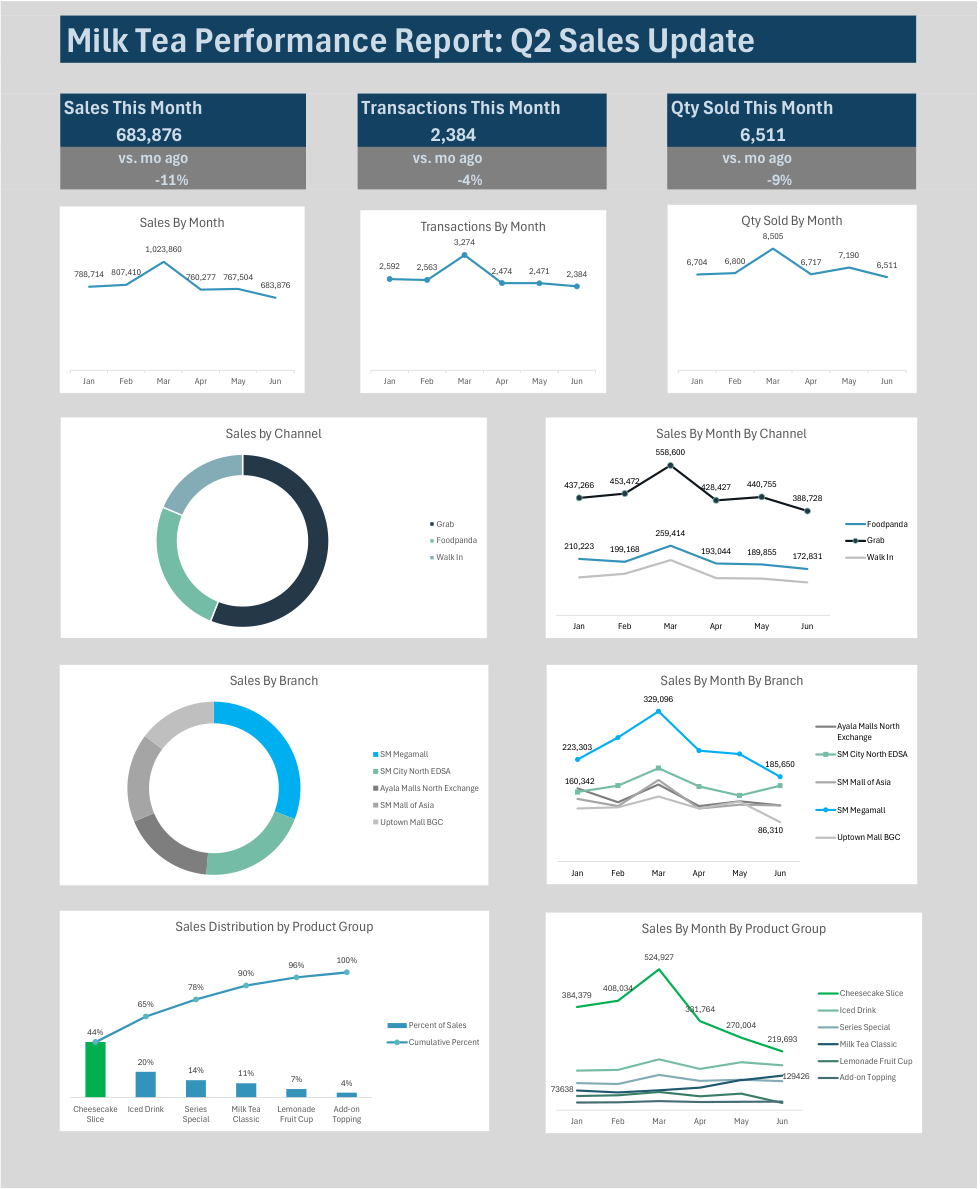
An end-to-end Python data pipeline and automated Excel dashboard, tracking revenue, delivery channels and product trends across 5 store locations.
PROBLEM: tracking down why sales dropped over a quarter and getting real store data.
SOLUTION: To solve the problem of unavailable retail dataset, a custom Python script (architecture) was used here to build a highly realistic transaction dataset from scratch. The python dataset built in transaction-level data with cohorts by channel, seasonal shifts and branch performance drops in order to run a proper root-cause analysis.
INSIGHTS: Cheesecake slice sales are the key driver of the dip. Key channel driver is Grab app. Key location driver is the SM Megamall branch. Milk tea sales gains didn't offset losses in the cheesecake category.
RECOMMENDATIONS: Take advantage of the milk tea sales increase momentum. Investigate delivery issues in both Grab app comments and feedback, and fix / optimize delivery process. Gather frontline feedback especially from SM Megamall branch.
A data pipeline that moves Xero accounting data into Google BigQuery automatically, applies a transformation layer using dbt, and produces analytics-ready tables that can be queried across all invoices, clients, and time periods simultaneously. Includes a Data Studio (Looker Studio) Dashboard for Revenue and Service Type toplines that are directly querying from BigQuery.
Click Here for Analyst's Revenue Insights
Click Here for the Full Pipeline Details
Click Here for the Data Quality Findings

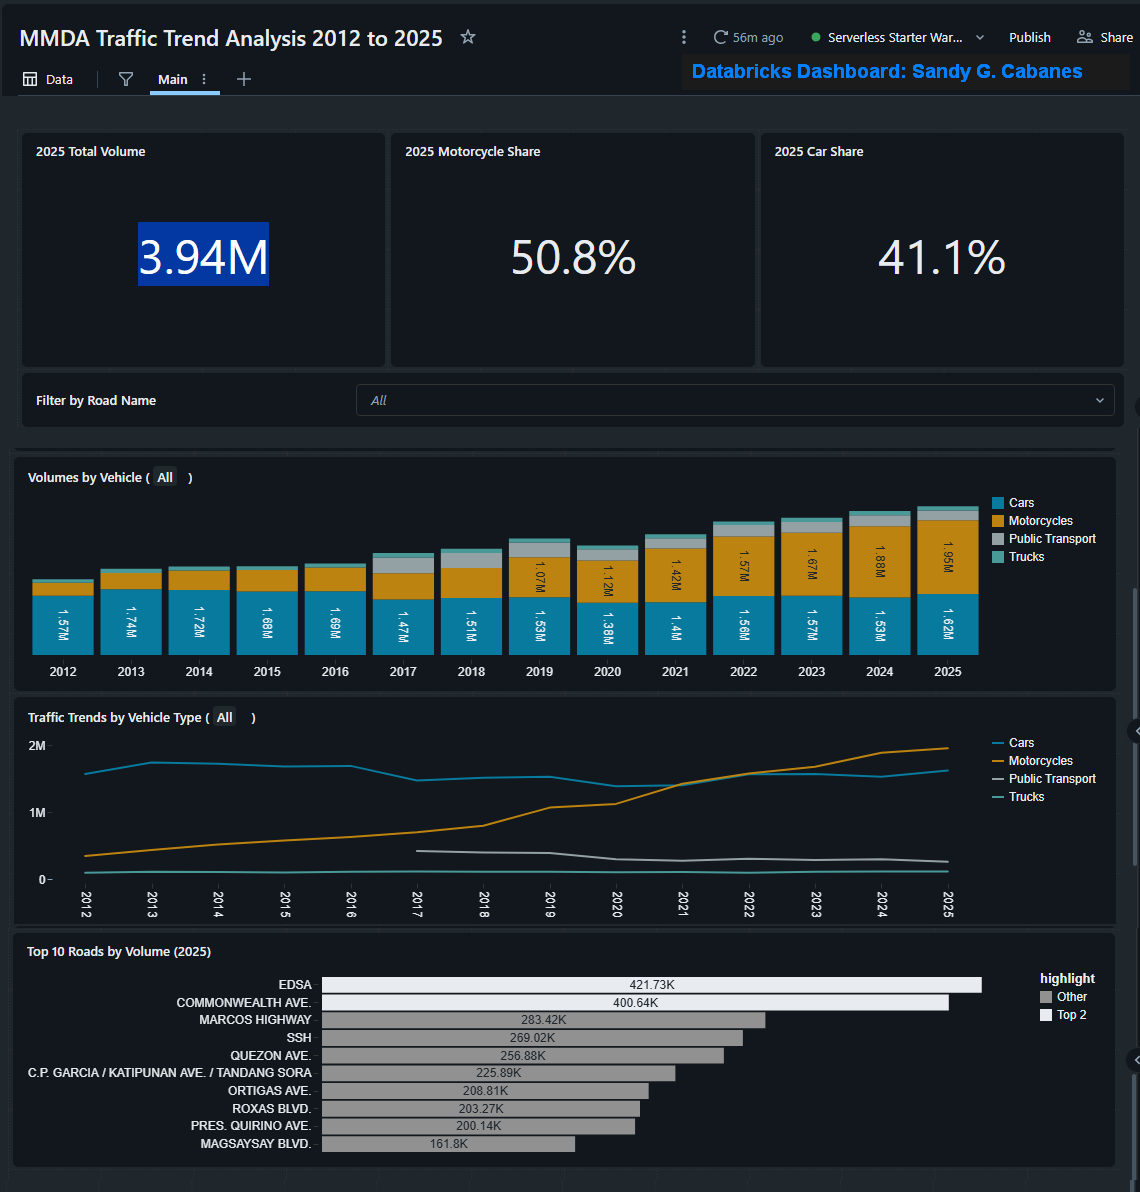
Applies modern data workflow in the Databricks cloud platform. Parsed annual traffic data from Metro Manila Development Authority portal that are only available in scanned pdf hard copies of reports. Data from pdfs automatically stored as delta tables in Databricks.
Applies raw data transformations using Postgres in Supabase, exports a materialized view into Google Sheets as final gold table, and links Data Studio (Looker Studio) to the Google sheets. Surfaced insights about revenue trends, revenues by markets and products.
Click Here for Analyst's Report to Stakeholders

Click Here for Analyst's Report to Stakeholders

Click Here for Analyst's Report to Stakeholders
[ ]
]

- ECommerce Sales and Customer Analytics With Supabase Google Sheets and Looker Studio
- RetailCo Holiday Sales Insights with DBT and Python
- Health Code Compliance Analysis for NYC Restaurants Using SQL, Power BI
- Market Size Revenue and Share Estimates of Electric Vehicles in WA -R, Excel, Python
- Anonymized Real-World Data Using Bayesian Networks to Protect Privacy - Python
- Privacy Protection Using Bayesian Networks on Real World Survey Data to Produce Anonymized Dataset - R
- Interactive Dashboard Public Link -Tableau
- Latin America Urbanization Storytelling with Data - Power BI
- Python - Automated Data Processing of Raw Data
- Python - Unicode Flowchart Builder App
- Python - Converting mp4 to gif
Data Engineering: