Repository navigation
Visual Model Atlas
The visual atlas gives a fast route from images to repository evidence. Each image should be read together with its source file and verification command.
| Visual | Repository path | Primary interpretation |
|---|---|---|
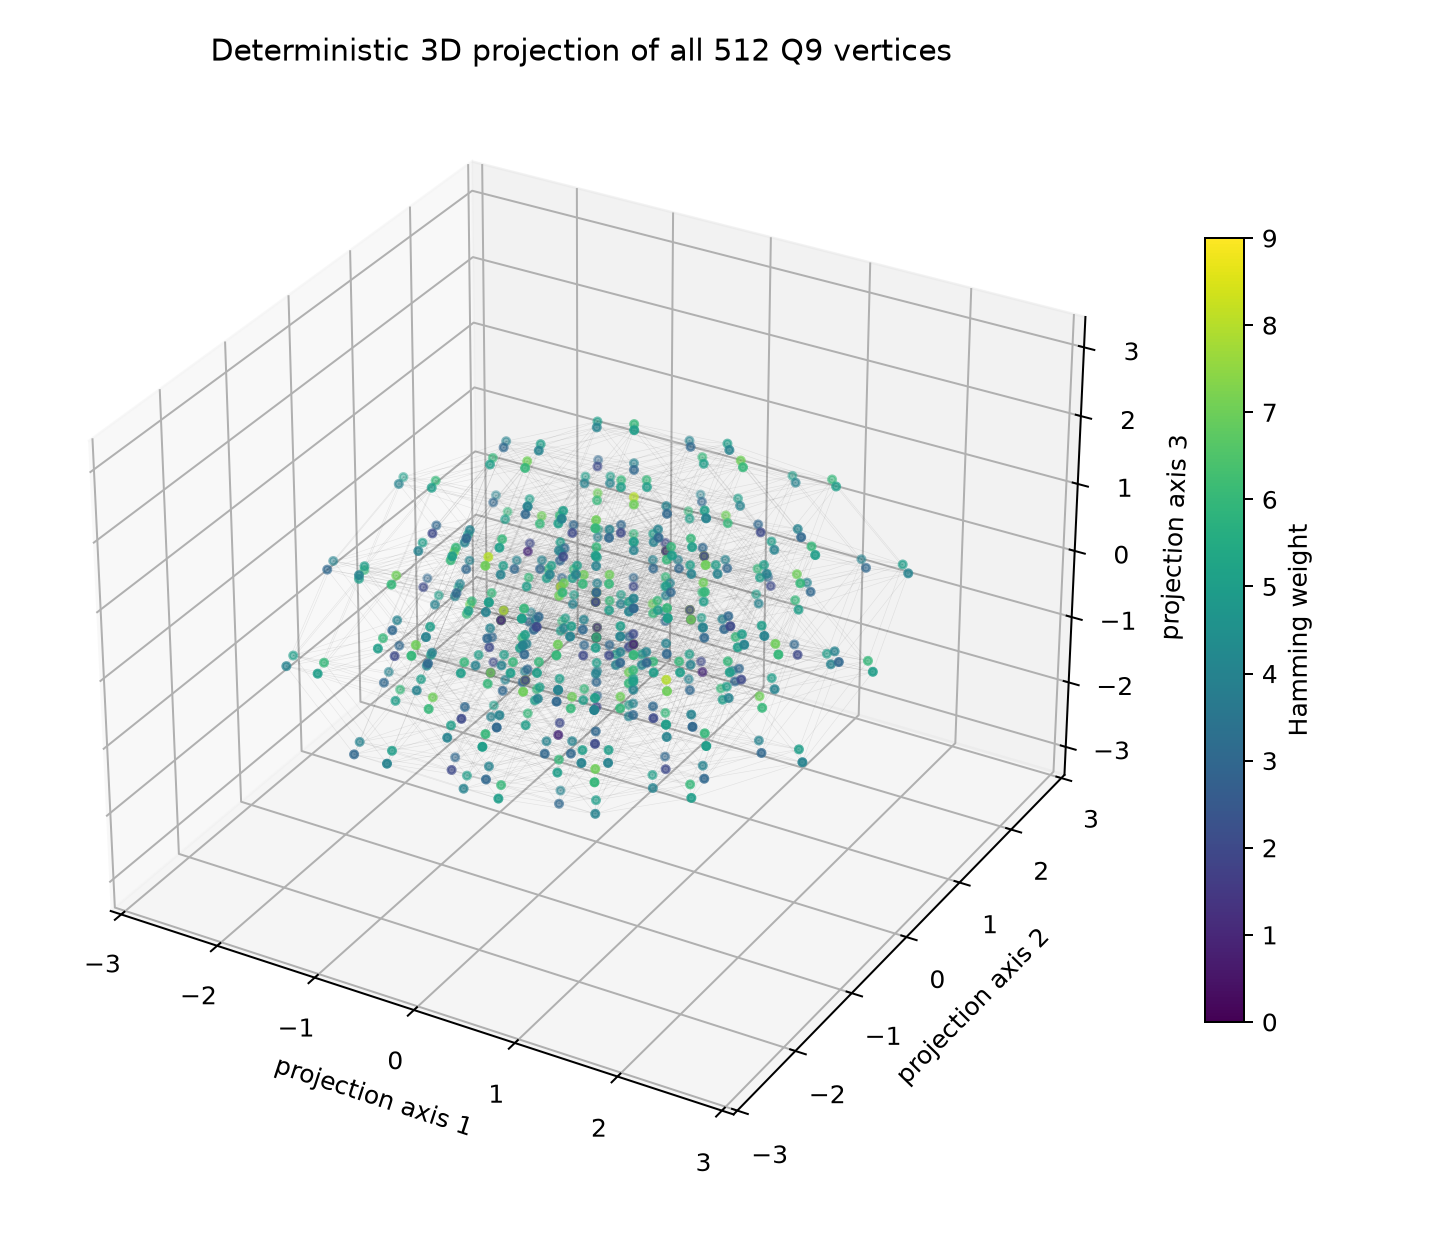
| Hypercube projection | figures/hypercube-3d-projection.png |
Finite state geometry orientation |
| Adinkra graph | figures/adinkra-graph-colored.png |
Quotient and Garden layer orientation |
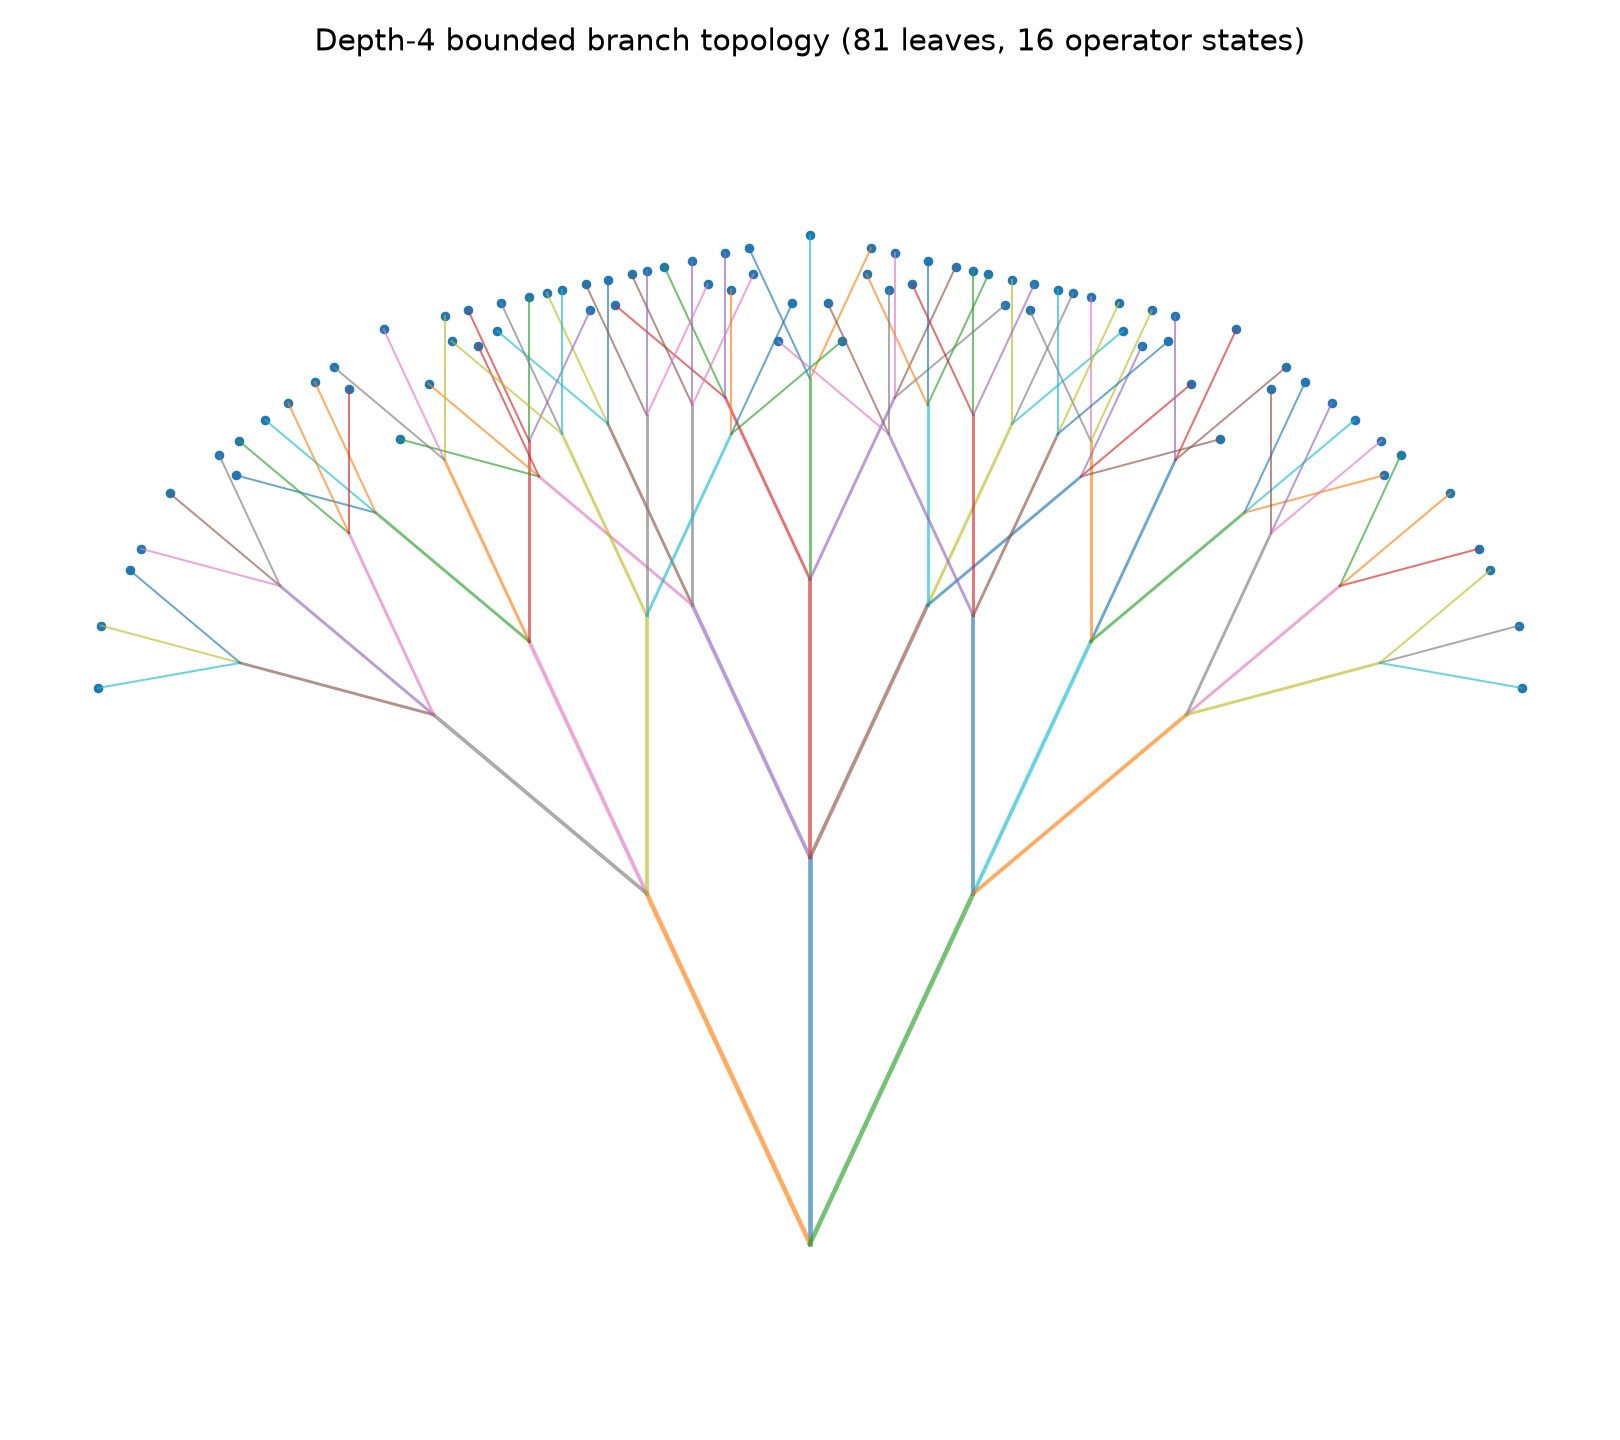
| Branch topology | figures/branch-topology.png |
Depth-4 branch tree structure |
| Single-bit error | figures/single-bit-error.png |
Decoder neighborhood illustration |
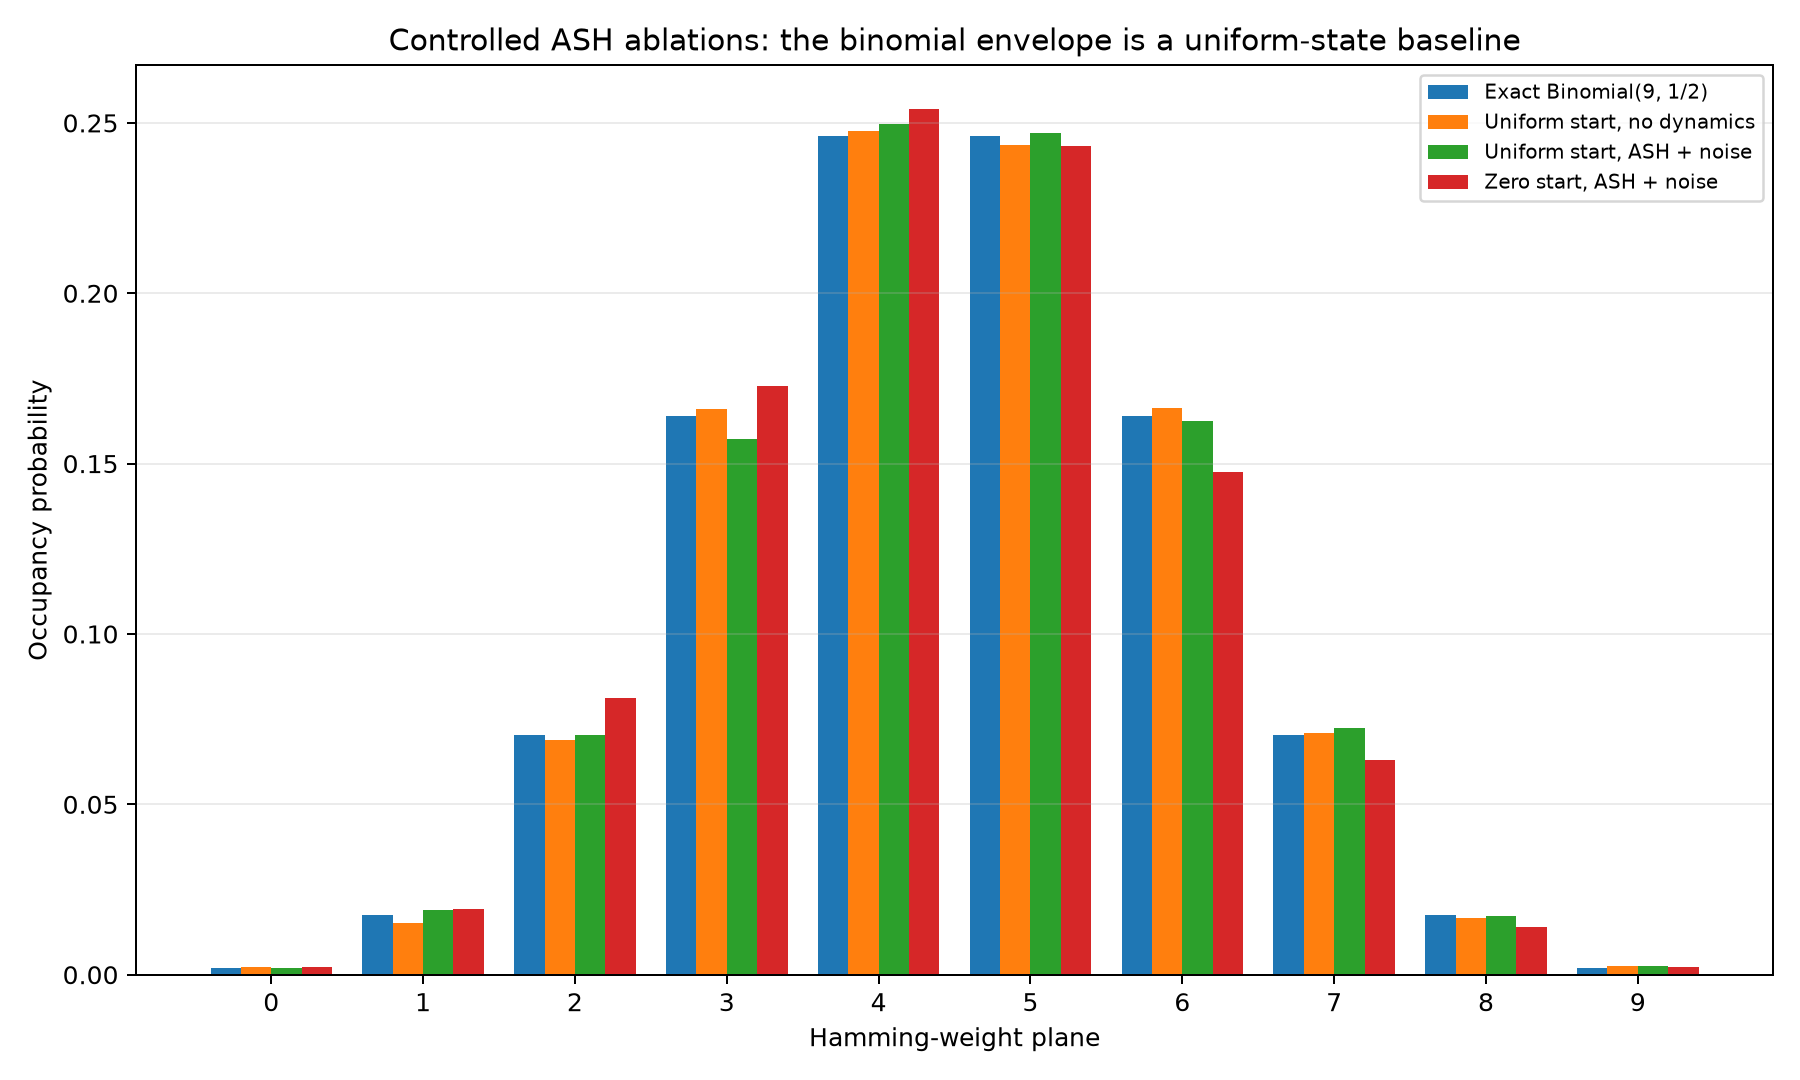
| Simulation histogram | figures/simulation-histogram.png |
Controlled finite-hypercube occupancy baseline |
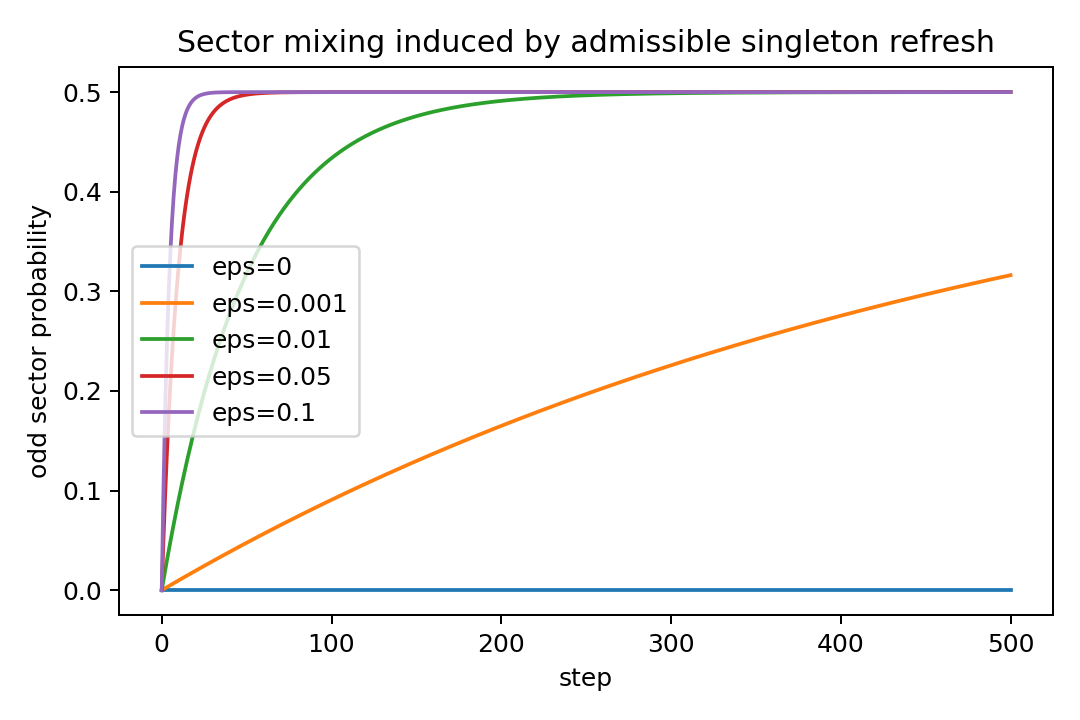
| Sector mass over time | figures/ash-physics-sector-mixing/sector_mass_vs_time.png |
Payload-sector refresh behavior |
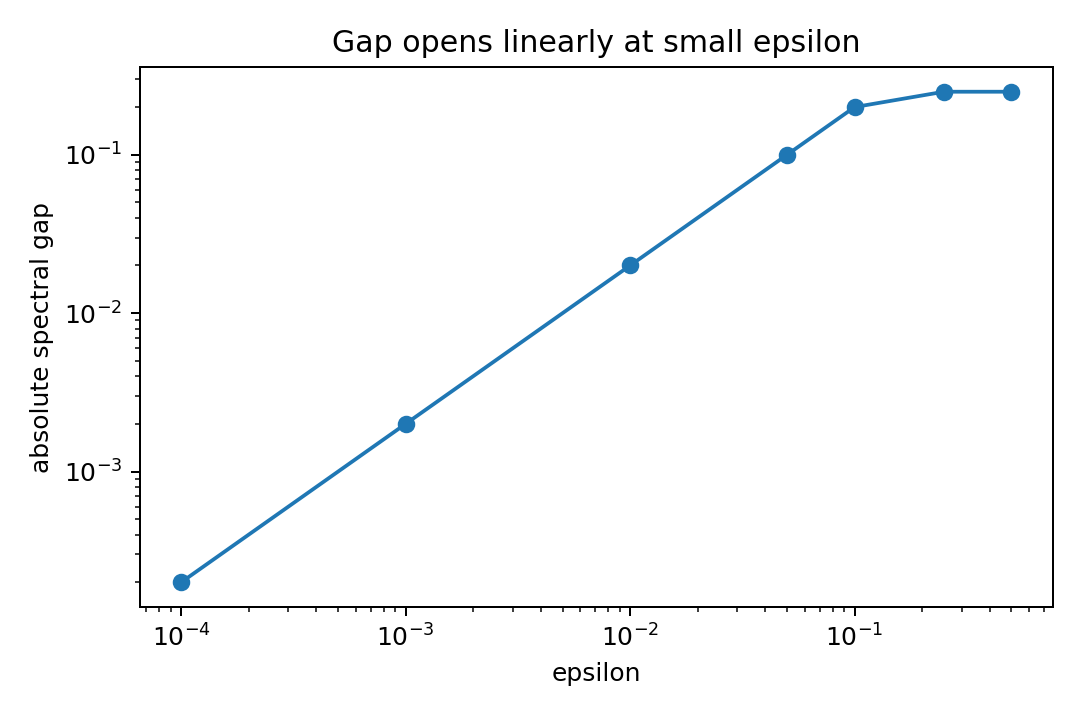
| Spectral gap versus epsilon | figures/ash-physics-sector-mixing/gap_vs_epsilon.png |
Sector-mixing workbench spectrum |
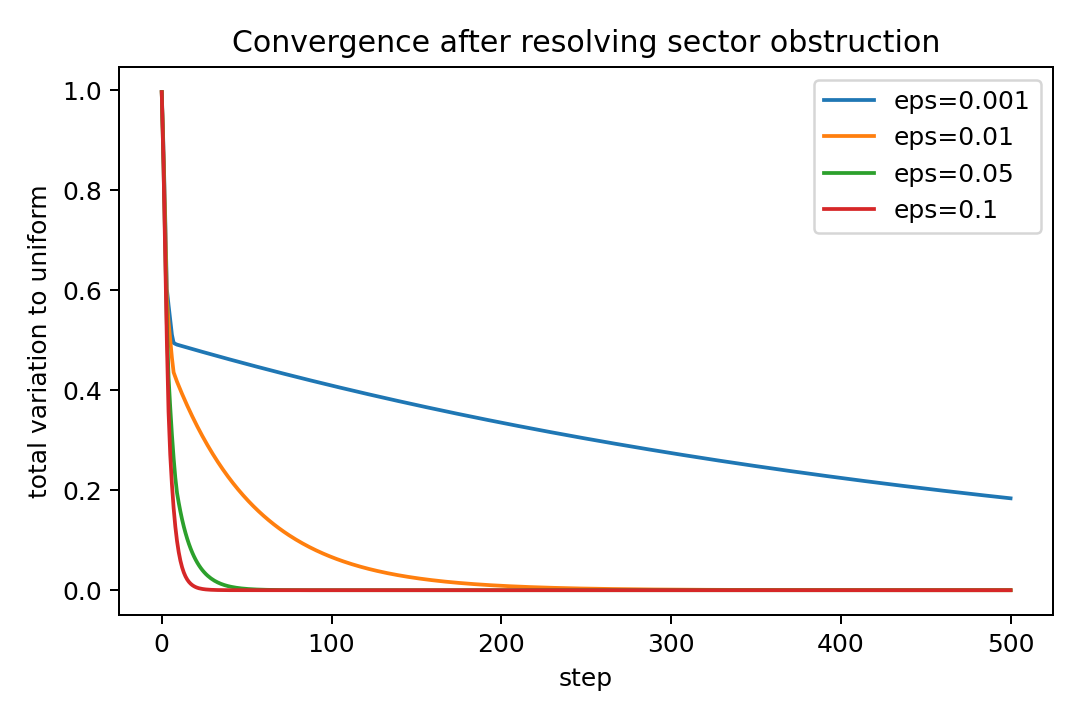
| Total variation convergence | figures/ash-physics-sector-mixing/tv_convergence.png |
Convergence diagnostic for the workbench |
If code, data, or figure source changes, refresh artifacts intentionally and verify hashes:
python tools/generate_artifacts.py --refresh-figures
python tools/check_generated_outputs.py . --include-manuscriptFigures help communicate structure. They do not upgrade synthetic diagnostics into external validation, and they do not substitute for the proof certificate or tests.